
Why Real-Time Supply Chain Visibility Isn’t Optional
In today’s globalized, multi-tiered supply chains, waiting for end-of-day reports just doesn’t cut it anymore. Delays, inventory gaps, and demand shifts can all snowball into operational chaos—and lost revenue.
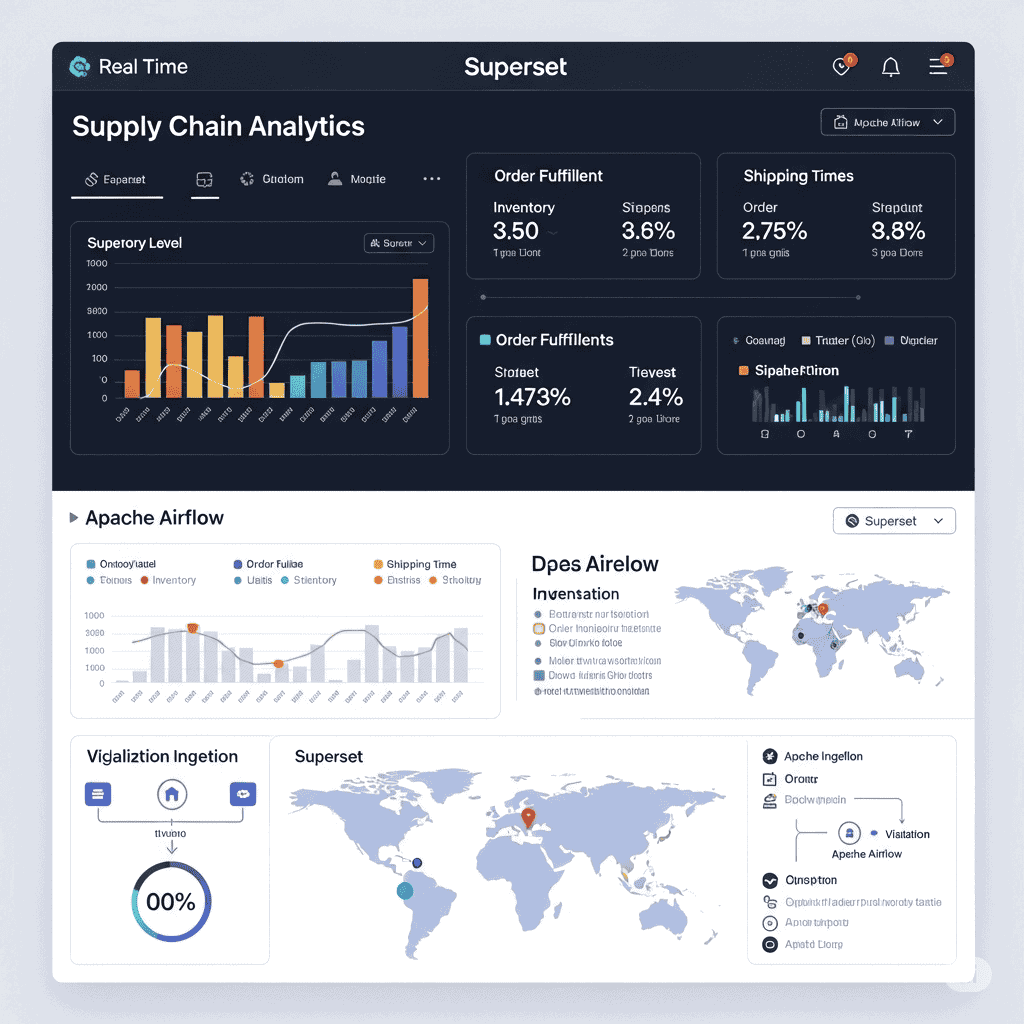
That’s where real-time dashboards come in. By pairing Apache Airflow (for data orchestration) with Apache Superset (for visualization), you get more than reports—you get live, actionable insights across your entire operation.
Apache Airflow: Your Data Orchestration Powerhouse
Airflow isn’t about visuals—it’s your data movement engine. It automates the flow of data between systems, ensuring timely, repeatable, and consistent data ingestion.
How Airflow fits into supply chain operations:
- Pulls raw data from ERPs, WMS, GPS, and supplier portals
- Cleans and transforms that data using repeatable jobs
- Schedules updates every 15 minutes, hourly, or as needed
- Loads clean data into a central warehouse like PostgreSQL, BigQuery, or Snowflake
In short: Airflow replaces manual data wrangling with automated, scalable workflows.
Apache Superset: Instant Visuals on Clean Data
Superset is an open-source dashboarding tool that connects directly to SQL-based data stores. Once Airflow pushes clean data into your warehouse, Superset lets you explore and visualize it—fast.
What makes Superset ideal:
- Connects directly to your data warehouse
- Drag-and-drop dashboards—no coding required
- Supports filters, slices, and drill-downs
- Lightweight, free, and scalable
Example dashboards you can build:
- Shipment delay tracker by vendor or route
- Inventory heatmaps by SKU or warehouse
- Order cycle trends over weeks or months
Airflow + Superset: Seamless Integration Flow
Your real-time pipeline might look like this:
- Airflow pulls data from SAP, warehouse logs, or IoT sensors
- Processes and transforms it using Python, SQL, or Spark
- Loads it into a central warehouse
- Superset connects to that warehouse and displays live dashboards
This loop can be set to run as frequently as your business demands. The key? No one has to manually refresh reports—it just works.
Key Metrics That Drive Supply Chain Decisions
Here’s what smart dashboards should actually track:
- Order Cycle Time: Time from order to final delivery
- Fill Rate: % of orders fulfilled from current inventory
- Inventory Turnover: How often stock is replaced
- Supplier Lead Time: Days from order to arrival
- Transport Utilization: Space or weight usage per trip
With Superset, these can be displayed as:
- Live KPIs
- Line charts
- Regional breakdowns
- Historical comparisons
Real Impact on Operations
With real-time dashboards:
- You catch late shipments early
- Spot and reduce excess inventory
- Align procurement, logistics, and sales teams with a shared source of truth
- React to issues before they impact customers
You shift from reactive firefighting to proactive decision-making.
How to Stay Budget-Smart
Both Airflow and Superset are free and open-source. But infrastructure can still add up if you’re not careful.
Tips to keep costs down:
- Use spot instances or auto-scaling VMs for Airflow workers
- Schedule jobs only as often as needed
- Archive old data regularly
- Set monitoring and alerting on failed pipelines
In many cases, the money saved by reducing late freight fees or stockouts outweighs any infrastructure spend.
A Few Caution Flags to Watch
Even a great setup needs careful planning.
- Bad data = bad dashboards: Garbage in, garbage out.
- Latency in source systems: Know how often your ERP or WMS updates.
- Mismatched definitions: Align on terms like “lead time” across departments.
Tip: Get stakeholder alignment early. It prevents downstream headaches.
Conclusion: More Than Dashboards—It’s a Supply Chain Nerve Center
With Apache Airflow doing the behind-the-scenes orchestration and Apache Superset delivering live dashboards, you’re not just “monitoring” your supply chain—you’re commanding it.
This system scales. It adapts. It makes your team faster.
And most importantly, it shifts the supply chain conversation from reaction to real-time optimization.
Read more posts:- Building a Real-Time Energy Usage Visualizer with InfluxDB and Chart.js


Pingback: Building a Decentralized Review System ->Cardano & Next.js