Posted inBlog Developing a Real-Time Urban Noise Pollution Monitor with IoT and Grafana Posted by Internboot August 27, 2025 Noise is everywhere—traffic, construction, street vendors, generators humming at night. Most cities just deal with…
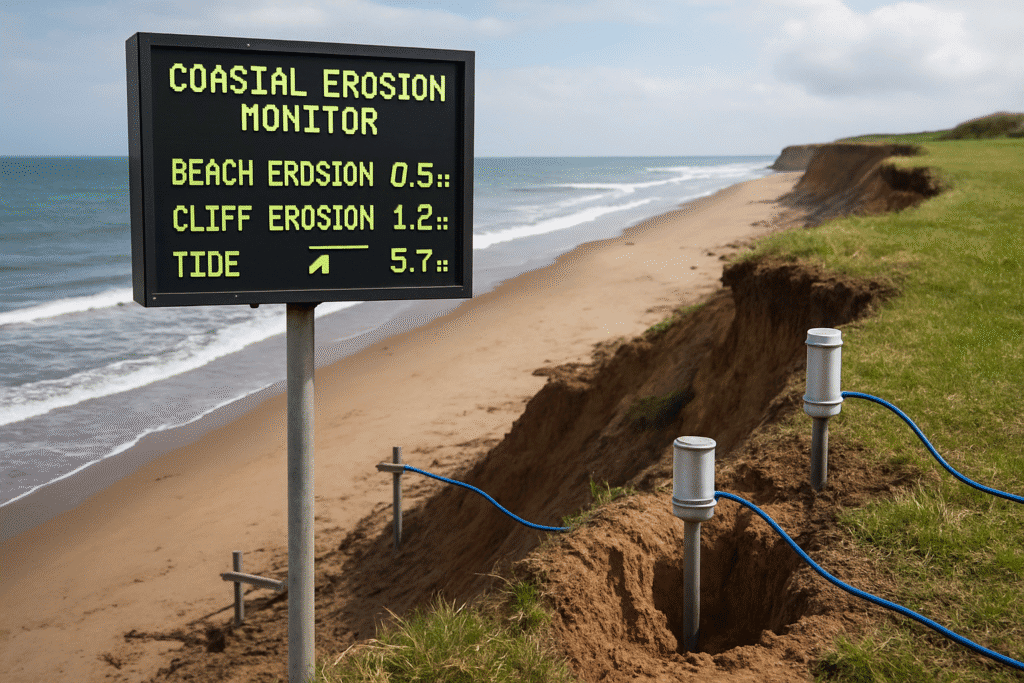
Posted inBlog Watching the Tides Change: How I Built a Live Coastal Erosion Monitor Posted by Internboot July 31, 2025 If you’ve ever returned to a favorite beach and noticed the dunes have shrunk or…
Posted inBlog Developing a Real-Time Server Performance Profiler with eBPF and Grafana Posted by Internboot July 28, 2025 Keeping servers online is one thing. But keeping them healthy? That’s where the real work…
Posted inBlog IT and Technology A Real-Time System Performance Profiler with eBPF & Grafana Posted by Internboot July 21, 2025 System performance monitoring isn’t just a nice-to-have—it’s essential. With infrastructure becoming more distributed and complex,…
Posted inBlog IT and Technology Visualizing Network Traffic in RealTime with Zeek & InfluxDB Posted by Internboot July 18, 2025 Ever Wonder What’s Really Happening on Your Network? We’ve all been there. The internet slows…
Posted inBlog IT and Technology Built a Live Traffic Dashboard with OpenTelemetry & Grafana Posted by Internboot July 15, 2025 The Frustration That Sparked It All You know the drill. It’s 2 PM on a…
Posted inBlog IT and Technology Built a Watchdog with Prometheus and Node.js Posted by Internboot July 15, 2025 The Slack Ping That Sparked It All You know the one. “Hey, is the app…
Posted inBlog IT and Technology A Real-Time Intrusion Detector with Suricata and Grafana Posted by Internboot July 14, 2025 The Paranoia That Sparked a Project I’m the kind of person who panics when my…
Posted inBlog IT and Technology Building a Real-Time Analytics Dashboard with Apache Spark Posted by Internboot July 11, 2025 What’s the Deal with Real-Time Dashboards? Let’s face it—nobody wants to wait 10 minutes for…
Posted inBlog IT & technology API with Prometheus and Grafana Posted by Internboot July 11, 2025 When "Is the API Down?" Became My Daily Alarm Let’s be honest—there’s nothing like waking…