
If you’ve ever returned to a favorite beach and noticed the dunes have shrunk or the cliffs seem a little closer to the edge, you’ve seen coastal erosion in action. It’s a quiet, constant force. For the longest time, the way we tracked it felt outdated—yearly surveys with delayed reports that couldn’t keep up with real-time change.
I wondered: in the era of instant everything, why can’t we watch coastal erosion in real time?
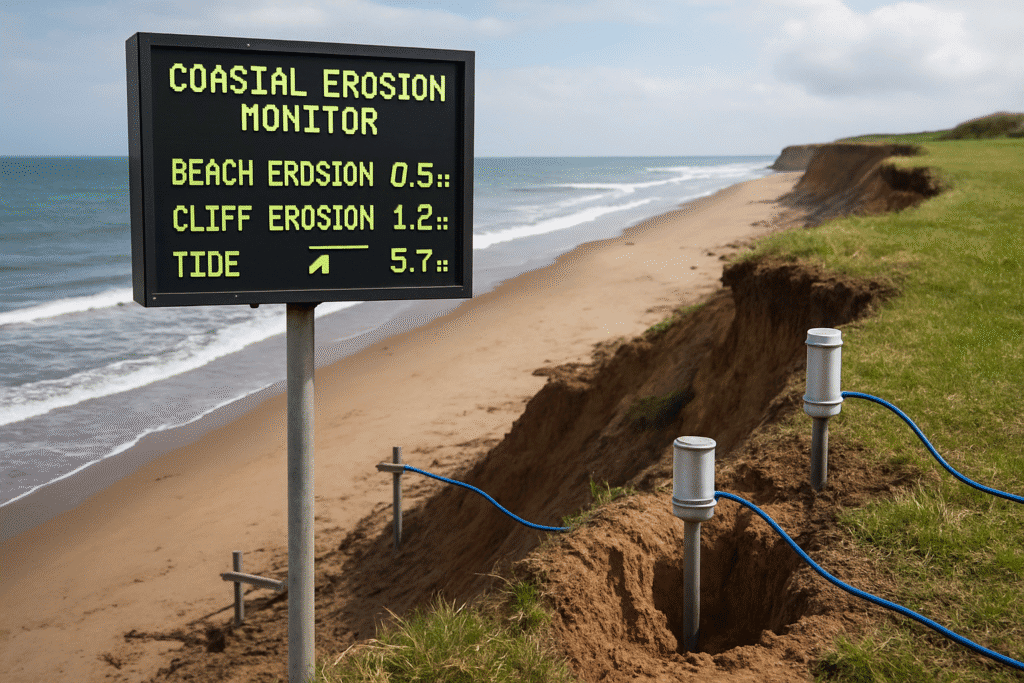
That question turned into a passion project—building a live coastal erosion monitor using GPS sensors, a Node.js backend, and a powerful time-series database called InfluxDB. This isn’t a lab experiment—it’s a practical tool for town planners, scientists, and anyone trying to understand how fast our coastlines are really shifting.
The Gear That Makes It Possible
To track erosion live, I had to stitch together a small but mighty tech stack. Think of it as a digital bucket brigade, handing data from shore to screen:
- Sensors (The Eyes on the Coast): High-precision GPS units staked into cliffs or dunes provide latitude, longitude, and elevation—updated frequently with timestamped readings. Some advanced setups could also include LiDAR or drone scans for more detailed terrain mapping.
- Node.js Server (The Data Traffic Cop): This lightweight backend application catches incoming GPS data, verifies its format, enriches it with metadata (like sensor ID and location), and preps it for storage.
- InfluxDB (The Time-Series Powerhouse): Unlike traditional databases, InfluxDB is built for timestamped data. It handles huge streams of incoming metrics and lets you ask fast, complex questions about how things change over time.
A Single Data Point’s Journey
Let’s walk through how a single erosion reading goes from sand to screen:
- A GPS sensor takes a reading and sends it to the Node.js server.
- The server checks for accuracy, adds helpful tags like
sensor_id: "cliff_top_01"andlocation: "north_beach", and formats it. - That data is pushed to InfluxDB with its precise timestamp.
- Once stored, the data becomes queryable—for example:
- “How much elevation did cliff_top_01 lose during last night’s storm?”
- “What’s the monthly rate of change across all beach sensors?”
To make this usable, I connected InfluxDB to Grafana, an open-source dashboard tool. Within hours, I had:
- Real-time graphs of elevation per sensor
- A live map with color-coded markers showing erosion severity
- Automated alerts if a sensor reports a sudden drop in ground level
What I Learned Along the Shoreline
Like any real-world project, this one came with its lessons:
- Tag Everything: InfluxDB thrives on tags. Labeling data by sensor ID, type, and location made querying simple and scalable.
- Summarize for the Long Haul: Raw, minute-by-minute data is great for storm tracking, but it’s overkill for long-term trends. I configured automatic rollups in InfluxDB to generate daily and monthly summaries to keep performance sharp.
- Nature Doesn’t Care About Code: Coastal hardware takes a beating. Salt, wind, and shifting sand can knock sensors offline. Expect data gaps, and build in logic to handle and flag anomalies gracefully.
Why It Matters
This project began as a personal challenge. But the more I worked on it, the clearer the implications became.
Real-time environmental data gives us the power to respond instead of react. With this system, coastal communities can:
- Monitor erosion daily, not annually
- Inform smart infrastructure decisions, like where to build seawalls or reroute paths
- Provide up-to-date data to researchers, enhancing the accuracy of climate models
We’re no longer limited to retrospective studies. With the right tools and a bit of code, we can watch the land shift in real time—and maybe even get ahead of it.
Conclusion
- Live sensors + Node.js + InfluxDB + Grafana = a powerful, affordable erosion monitor
- Tagging and data rollups are key to managing and querying high-volume time-series data
- Building for resilience—both in hardware and code—is crucial when working with nature
- Real-time environmental insight empowers smarter planning and faster responses
Whether you’re a coastal researcher, a curious developer, or someone who simply loves the sea, building tools like this bridges the gap between tech and terrain. The tides may keep changing, but now we can watch—and learn—as they do.
Read more posts:- What Am I Breathing? Building a CO₂ Tracker to See the Air Around Me

