
You know that feeling?
You’ve just poured your heart and soul into building a new API. You’ve launched it out into the world, and then… you’re met with silence. A deafening silence where you’re just left wondering:
- Is anyone using this thing?
- Is it fast?
- Is it crashing?
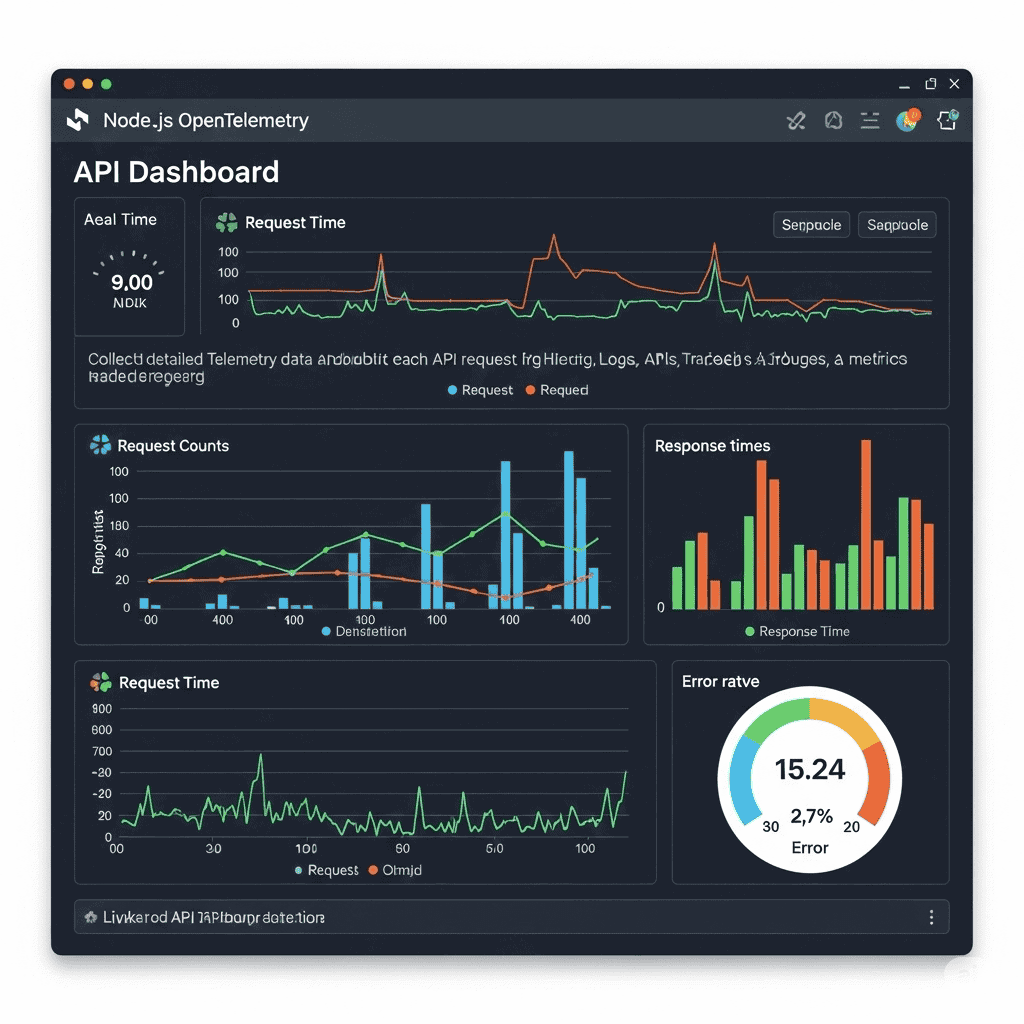
Running an API without a real-time dashboard is like running a retail store with the doors open but you’re stuck in the back room with no way to see if customers are coming in, what they’re looking at, or if they’re walking out frustrated. It’s a feeling of complete helplessness.
But what if you could have a live, dynamic view of everything that’s happening? A mission control for your API that tells you its story, second by second?
The good news is, you don’t need some crazy expensive enterprise software to do this. You can lay the groundwork for it yourself with some amazing open-source tools like OpenTelemetry and Node.js.
Giving Your API a Voice with OpenTelemetry
So, how do you get your API to start talking?
You need a way to collect all the juicy details—how long each request takes, which endpoints are getting hammered, and how many errors are popping up.
You could try to write all this logging code yourself, but trust me, it’s a rabbit hole you don’t want to go down.
This is where OpenTelemetry comes in—and honestly, it’s a bit of a lifesaver.
Think of OpenTelemetry like this:
You’re giving every single request that hits your API its own tiny little fitness tracker.
As that request travels through your system, its tracker is recording everything:
- Speed (latency)
- Stress level (errors)
- Route taken (endpoint/path)
And because OpenTelemetry is an open standard, it speaks a universal language of monitoring. That means you’re not locked into any specific vendor or expensive platform. You’re free. It gives your API a voice, and you choose who it talks to.
The Mission Control Room: Bringing It All to Life with Node.js
So now you’ve got this stream of real-time “fitness data” pouring out of your API.
Where does it go?
You need a central hub to catch it, analyze it, and display it—and not in a spreadsheet that looks like it came from 1998.
This is the perfect job for Node.js.
Node.js excels at handling real-time information.
You’d use it to build a fast, lightweight backend that acts as your dashboard’s brain. It would do two things:
- Listen for all the telemetry data coming from OpenTelemetry
- Instantly broadcast it to a web-based dashboard
That’s what gives you that magical “live” feeling.
You’re not refreshing the page like it’s 2005—you’re watching a living interface.
Requests tick up in real time. Errors spike visibly. Performance dips are shown the second they happen.
It’s like flipping on the lights in a room you’ve been stumbling through in the dark.
The Fun Part: Playing Fortune Teller with Your Data
A live dashboard is more than just a pretty screen. It’s your early warning system—and even better, your crystal ball.
Once it’s been running for a while, you’ll start to notice patterns.
You’ll stop just reacting to the past, and start predicting the future.
You’ll say things like:
- “Looks like every Tuesday morning, a big customer syncs their data.”
- “That /api/search endpoint is getting 15% slower each week. We need to optimize it before it explodes.”
Now, you’re not just fixing things—you’re preventing them.
You’re not a firefighter anymore. You’re a systems architect with foresight.
Conclusion
The biggest thing a real-time dashboard gives you is peace of mind.
You’re replacing the anxiety of the unknown with the confidence of visibility.
By using OpenTelemetry to give your API a voice, and Node.js to build a place to listen, you create a mission control that tells you exactly what your API is experiencing in real time.
You’ll build better products.
You’ll fix issues faster.
And yes—you’ll finally sleep better at night.
Stop guessing. Start knowing.
Read more posts:- Your App is Crashing and You Have No Idea Why. Let’s Fix That.


Pingback: Why [Your Cloud Platform] Is the Key to Scaling Your Startup